Westinghouse Network Analyser
Part 1 Nature of Power Systems
Electricity around the world is produced by electrical generators with a number of generator units grouped into power stations. Larger sized generators are driven by turbines with energy supplied by the combustion of various fuels, eg. coal. gas, oil, from nuclear processes or, alternatively, from the energy stored in hydro dams.
The generators supply electrical energy for the needs of the local population, comprising industry and transport, commerce and domestic loads. The size of the total electrical load varies throughout the day and with the day of the week. As an example, the load could be heavy, mid morning on a cold Tuesday or during the afternoon on a hot Thursday. The electrical load will be at its minimum overnight, when most of the population are asleep.
Electrical energy is dispatched to the loads by major electrical connections called transmission lines. Often there is considerable distance between generators and their loads and the transmission lines will then be quite long.
An electrical load is supplied by electrical energy measured in Joules at a power level measured in Watts (or more realistically in kW and MW.) Most loads also require an electrical quantity known as reactive power measured in Vars, KVars or MVars. Part of the Var requirement is met by additional special equipment, installed to supply Vars, for example capacitor banks.
In summary we have so far identified the four key elements of a power system namely:
Generators, loads, transmission lines and reactive power sources.
There are two important matters in the operation of a power system that require the attention of electrical engineers. The first is a study of the system under all possible loading conditions, not only heavy loads and light loads but also for different arrangements of generators and loads. These are classified as steady state conditions.
The second is a study of how the power system behaves under sudden, sometimes dramatic events such as a major fault somewhere in a power system. For example a transmission line can be suddenly struck by lightning causing a flashover between the phase conductors of the transmission line. These are known as transient events and can result in the adverse behaviour of a power system requiring rapid remedial action.
There are two ways to conduct theoretical studies of a power system. The modern way is to use mathematics to design a mathematical model of a power system. Each component
of a power system, such as a generator can be represented by a set of mathematical equations. Hence particular events can be studied using a computer.
Before computers were invented, a way to predict the behaviour of a power system was to build a series of small electrical models of the various components, eg. the generators and the transmission lines, and these were inter-connected electrically in the same arrangement as in the actual power system. The whole system was known as an analogue network analyser.
Westinghouse Network Analyser
The Network Analyser built by the Westinghouse Co. of the USA is an example of an analogue network analyser. The analyser was manufactured by the Westinghouse Electric Corporation (Pittsburgh, USA) and was supplied to the State Electricity Commission of Victoria (SECV) in the year 1950. The analyser was used by the SECV for the development of the Victorian electrical power system into the 1960s.
At this time the analyser became obsolete because of the development of computer programs that represented the steady state and transient operation of a power system.
The Westinghouse Analyser was made available to the Department of Electrical Engineering at Monash University, Clayton in 1967 and it was used for undergraduate teaching in power systems until 1985. As had happened earlier, computer representations of power systems were then developed for undergraduate teaching and the Westinghouse system analyser, at the university, fell into dis-use.
Equipment represented on the analyser
The analyser uses a single-phase representation of the normal three-phase power system.
The following items of equipment are represented:
1. Generators and line connection (generator, reactance models)
2. Step up transformer (resistor, reactor and turns ratio models)
3. Transmission line (resistor, reactor and capacitance model
components)
4. Step-down transformer (resistor, reactor and turns ratio models)
5. Sub-station (resistor, reactor, capacitor units)
6. Electrical loads (Variable resistor and reactor units)
Information measured
The instruments in the analyser, located in a control desk and in the equipment racks, gave measurements of voltages and currents, real power and reactive power and phase angles.
Typical power system operating conditions that were studied
The representation of an actual power system was set up by inter-connecting the above model equipment with connecting leads.
As an example, a thermal power station with four generating units has three of its units operating and is connected via step up transformers to a transmission line that interconnects with a second nearby thermal power station with both of its two generators in service. A remote hydro power station is connected to the system by a longer transmission line. All three power stations supply power to a large city and the city electrical load is represented by a combination of resistors and inductors. These gave the required electrical power load at the selected load power factor.
Examples of typical problems that could be studied on the Westinghouse analyser were as follows:
1. The voltages at loads throughout a transmission and distribution system change with the loading magnitude, eg. heavy weekday load voltages were compared with light weekend night load voltages. These load flow studies were carried out giving information about the steady state system voltages throughout the power system for a given loading condition.
2. An example of a short circuit fault condition is when all phase lines are suddenly connected together. The analyser can be set up to represent the fault at the selected location. The flow of steady state currents throughout the power system with this fault condition was found using the analyser.
Note When a short circuit fault is applied there is a short transient period of a few seconds when the fault current will be quite high. The transient type problem is investigated using a transient network analyser that gives the current and voltage response from the instant the fault is applied to the time when steady state conditions prevail.
3. If a set of generators is loaded beyond a particular level, the generators become unstable because the generators have a maximum level of load beyond which the system becomes unstable. Instability means that the generator¹s rotational speeds exceed the normal synchronous speed. The analyser is used to find what this particular loading is, ie. to check the steady state stability. A margin is applied and power station operators are informed what the maximum system loading can be safely applied.
Part 2 Description of Network Panels
Introduction to analyser
The Westinghouse Network Analyser was developed in the USA in the 1940¹s to enable modelling of a power system by the physical interconnection of model power system elements. These model elements represented:
Generators, transformers, transmission lines, system reactors and capacitors, system loads
The various equipment racks of the analyser equipment were designed to model and represent the behaviour of the above system elements with parameter adjustment on the front panels.
The analyser when connected in a particular configuration to represent a required power system circuit, was used to measure the steady state behaviour of a given power system, ie. to investigate load flow behaviour. The analyser was also used to examine the stability of a system following a network incident such as a three-phase fault by a process called step-by-step analysis.
Note: Transient network analysers were developed some decades later, enabling a modelled transient event to be examined in real time.
Power supply to analyser
A 3-phase, 22 kW, synchronous motor (50 Hz, 2-pole) drove an 18.7 kVA, 3-phase synchronous generator (450 Hz, 18 pole). The generator set supplied the analyser with three phase electrical power. The higher generator supply frequency enabled the analogue inductive components to be smaller in physical size. The nominal generator output was 220V, 3-phase, 10-kW with voltage adjustable as required. Only one phase of the generator was used to energise the network analyser and the voltage was adjustable from 220V down to 180V.
Equipment racks
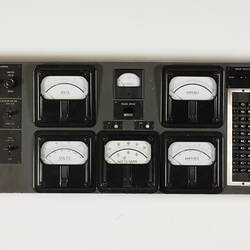
A brief description of individual equipment racks follows. The assembled analyser is shown in photograph #1. The analyser consisted of six adjacent panel units. To relate the following descriptions to the complete analyser shown in the above photo, the panels are designated, from left to right, panels A, B, C, D, E and F.
Generator units, 12 units, denoted G1 to G12, (panels C and D)
The generator units were the source of electrical power for the analyser and each unit could be used to represent a power system generator located within a particular power system. The generator units were assembled centrally in the analyser in panels C and D. They were each 3-phase induction regulators which allowed voltage adjustment and phase shifting. A single-phase supply was drawn from the 3-phase system to energise the selected transmission system. On the unit panel there are controls for voltage adjustment and phase shift comprising operating knobs and indicating scales. There were 12 generator units in the original SECV analyser.
A voltage selector switch enabled control of voltage range, which was either 200 to 400 volt, 100 to 200 volt or voltages below 100 volt. Actual currents from the units were up to 3 amp.
In an actual power system power flow P is controlled by changing the generator phase angle while reactive power Q is controlled by changing the generator field current. In the analyser P was controlled by adjusting the phase shifter and Q was controlled by adjusting the voltage regulator.
The Museum has been supplied with one example (1 unit)
Generator electrical measurements, 12 units, denoted G1 to G12, (panels C and D)
The output of each of the 12 generators in use was indicated on adjacent panels with three instruments for each generator, indicating voltage, current and power. These were mounted above the generator panels.
These units are called Generator Meter Units.
Generator reactance units, 12 units, denoted X1 to X12, (panels C and D)
The reactance of each generator was adjustable by selecting the reactance in ohms on the respective panel. The reactor panels were mounted below the generator panels in panel C and D. The available reactance ranges were 0 to 99.8 ohm or 100 to 499 ohm. Generators with high rating had a lower circuit reactance than a generator with smaller rating.
These units are called Reactance Units.
Line impedance, 30 units, denoted 1 to 30, (panels E and F)
Transmissions lines are represented by series line resistance (to represent the power losses in the line) and line reactance(effect of magnetic field) together with lumped shunt capacitance, (effect of electric field). The panel line impedance was adjustable, resistance 0 to 99.8 ohm or 100 to 399 ohm, and reactance was adjustable from 1 to 2401 ohm. In a typical transmission line the line reactance exceeds the line resistance.
These units are called Resistor/Reactor Units.
Load impedance units, 16 units, denoted L1 to L16, (panel A)
Normal electrical loads are lagging power factor resistance-inductive loads specified by the power dissipated and the power factor. For example a load block could be 200 MW at 0.9 power factor lagging.
On each load panel resistance could be varied from 0 to 998, 1000 to 3990 ohms and reactance was variable from 1 to 2401 ohms. The selected load resistance set the MW load and the load inductance set the reactive power. If required, power factor correction (ie. an increase of power factor to near unity) was achieved by connecting capacitors into the load circuit.
Load Impedance Units were not supplied by Monash. The Museum was supplied with a Load Adjuster Unit only. No Load Impedance Unit was supplied by Monash. It has probably been dumped - see * page 8.
Capacitor units, 12 units, denoted C1 to C12, (panel A)
The capacitor units were used to represent the use of power factor correction capacitors at the load centres.
Load circuit current measurements, 16 meters, (panel A)
The currents flowing in each of the loading circuits was indicated on corresponding circuit ammeters in centrally mounted units in Panel A.
These are the 16 meters on the Load Adjuster Unit - see * page 7.
Transformer impedance, 6 units, denoted P1 to P6, (panel F)
The circuit impedance of six auto-transformer models was adjusted to the required level by impedance racks in Panel F.
Plug connection rack, (panel B)
Each of the circuits required from the specific racks described above was terminated with two flexible cables connected into a 2-terminal plug. The plugs were inserted into specific sockets to form the required connection of generators, transmission lines and loads to represent the actual power system circuit under examination. The rack also contained the connections to transformers, which were connected into the circuit as required. Auto-transformers were used to allow tap-changing processes to be carried out in a given circuit. There are also circuit connections to six 1 to 1 ratio transformers on the rack to allow parallel circuits to be connected. One of the plug rows formed a common connection of circuit elements as usually required in a power system equivalent circuit.
Operator control desk
The control desk allowed the start-up of the motor-generator supply set, control of generator voltage and measurement of the generator frequency.
The desk also contained accurate meters for measuring voltage (0-125 or 0-250 volt), current (0.06, 0.2, 0.6, 2 or 6 amp), real and reactive power and operating phase angle. A keypad enabled readings to be obtained at various locations in the model power system circuit, ie. by switching relays the ammeter was connected into any required circuit and the voltage across the circuit was also measured. The readings were either scalar (ie. magnitude only) or vector (ie. magnitude, phase angle or components to any given reference angle).
Reference attachments
R1 Alternating current network calculator,
Westinghouse Electric and Manufacturing Co, November 1944
R2 Alternating current network analyser instruction book,
Westinghouse Electric Corporation, March 1950
W J Bonwick
Professor of Electrical Power Engineering (1991 to 1997)
Monash University
Clayton, Victoria
November 2002
More Information
-
Keywords
-
Authors
-
Article types