The majority of diagrams relating to CSIRAC originated in the Division of Radiophysics of the Council for Scientific and Industrial Research (CSIR), located in Sydney. During 1949 CSIR became the Commonwealth Scientific and Industrial Research Organisation (CSIRO).
After CSIRAC was moved to Melbourne during 1955, further items were produced by members of the engineering staff of the Computation Laboratory of the University of Melbourne, and there are several copies of drawings produced by the Division of Building Research, CSIRO, located at Highett.
Identification symbols
SK#### or SKE#### means the drawing is a preliminary sketch.
B#####, C#####, D#####, P##### means the drawing is officially part of the CSIRO Division of Radiophysics.
A single letter, for example, a C or a D by itself, means the drawing is a copy of an official drawing; the copy was made in Melbourne. A drawing would have been copied if it was illegible or in poor condition.
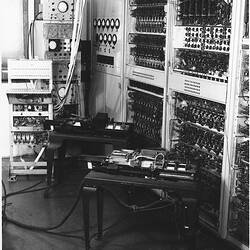
When CSIRAC was decommissioned in November 1964 it was carefully dismantled, and along with all the associated drawings and engineering log books was donated by Dr Frank Hirst to the National Science Museum of Victoria.
A hierarchy of diagrams
The functioning of CSIRAC was represented by a hierarchy of diagrams with block diagrams at the highest level, logical diagrams at the next and schematic diagrams at the lowest .
A block diagram is a diagram of a system such as CSIRAC, in which the principal parts or functions are represented by blocks connected by lines, that show the relationships between the blocks. It is used to gain an overall understanding of the system.
A logical diagram is a more detailed graphical representation of one of the principal parts of CSIRAC. Each functional component is represented by a symbol. The diagram shows the connections between these components. In CSIRAC, each functional component consisted of several physical components such as vacuum tubes, resistors and capacitors. Logical diagrams are used to understand the functioning of the circuit.
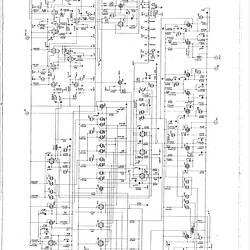
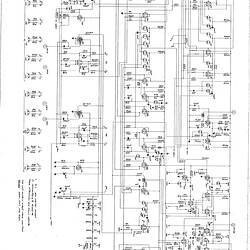
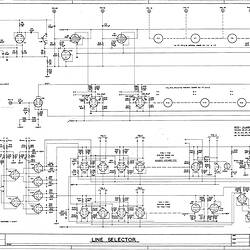
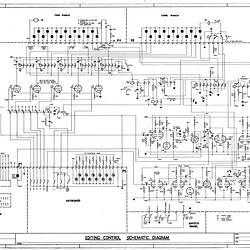
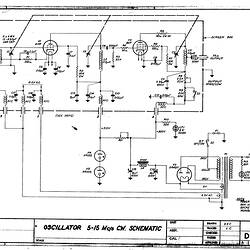
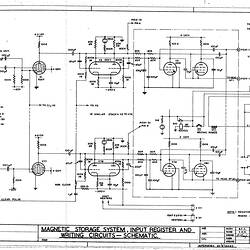
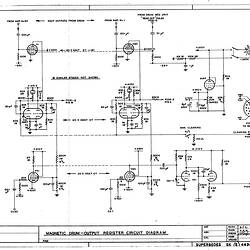
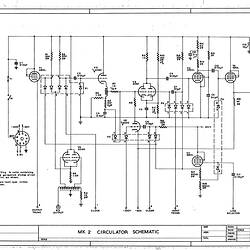
A schematic diagram shows the detailed connections between all the components in a circuit. They are used to build the circuit and later for testing. For CSIRAC, the most common components were vacuum tubes (valves), capacitors and resistors. Schematic diagrams are also known as circuit diagrams.
Other types of diagram
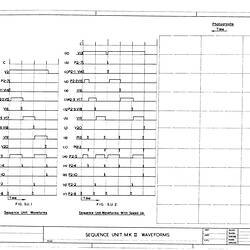
A timing diagram is a graph showing how a set of signals changes with time. The diagram shows the time relationship between different signals in a functional part of CSIRAC. They were used in designing the different parts and later for testing.
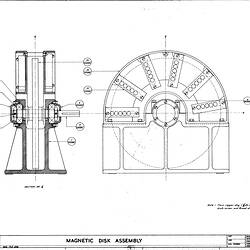
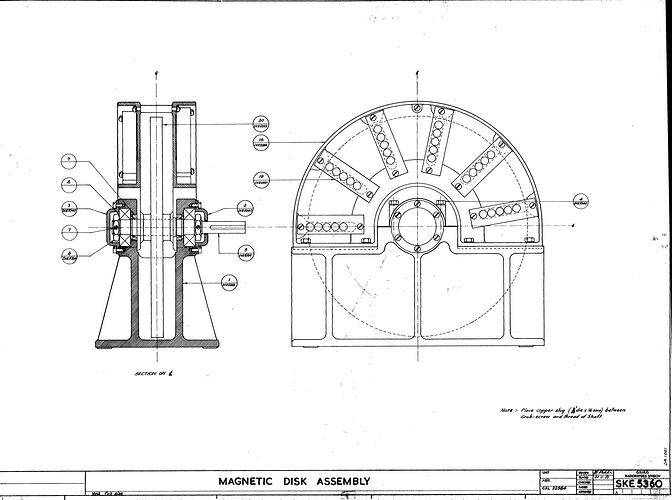
Mechanical drawings show the physical construction of a component. They were used to fully and clearly define requirements for the manufacture of CSIRAC's hardware.
Paper Sizes
The following information on paper sizes is from Australian Standard Engineering Drawing Practice (1944).
All sizes are in inches.
Prefix Letter Overall Finished Size (inches)
A 54 x 38
B 38 x 27
C 27 x 19
D 19 x 13½
E 13 ½ x 9½
F 9½ x 6¾
G 6¾ x 4¾
K 51 x 29
M 29 x 21½
P (Foolscap) 13¼ x 8¼
Q (Quarto) 10 x 8
Dating of drawings
The drawings cover the period 1947 to 1964 and beyond. Some drawing were not dated. Their dates were estimated based on Jurij Semkiw's knowledge (May 2009) of modifications and developments. For example, input/output first used cards, then 12 hole paper tape. 12 hole paper tape itself went through development; just before moving to Melbourne, a Mk II 12 hole paper tape reader and punch were installed. Other developments involved the Memory, the Arithmetic Organ and magnetic storage. The dates of these drawings that included these modifications were set generally in the range 1952 to 1955.
More Information
-
Keywords
-
Authors
-
Article types